Home | Gallery | AboutUs | Software | Rates ![]()
![]()
![]()
The NTSB initially released the public docket for Flight 1549 on June 9, 2009 and has since, in May of 2010, updated that docket. The docket contains a wealth of information that can be utilized in a full 3D reconstruction of the accident. Our work goes deep into the underlying framework of information and encompasses the entire spectrum of accident information. Integrating all spatial and temporal data allows us to approach this accident from a never-before-seen perspective. The ability to flexibly combine data, camera views and other visual elements is a key advantage in presenting an engaging real-time presentation of the accident sequence. All work you see on this page would withstand the rigors of qualification for presentation either as demonstrative evidence or, if sufficient witness testimony is available, real evidence. We have the capability to blend all of the information you see into any perceivable final product, depending on your specific visualization needs. The video below is best viewed full screen with HD enabled.
In September of 2016 we released a re-render of the original project assets leveraging new advances in viewing technologies. The new video is a full 4K resolution spherical 360 degree view compatible with standard browsers and smartphones. Viewed in-browser, click-drag to change viewpoint. Viewed on-phone, use your finger to reorient the viewpoint or simply "aim" the phone and the video will adjust according to accelerometer readings. If you have dual monitors, either start two copies of the 360 video or use this video for an excellent understanding of the complexity in communications. For the ultimate visual experience, use Google Cardboard, Samsung Gear, or similar immersive headset devices. Scroll to the bottom of this page to the section titled "Further Thoughts and Discussion" for some additional insight and updated talking points that have been common in the years since this accident.
Most people don't realize this, but the birds were visible on radar, before the event occured. After integrating the raw radar data into our 3D environment and creating motion targets representing those radar returns associated with the flock of birds, our timeline clearly depicts the intersection of Flight 1549 with birds at a time of around 1527:10 (HHMM:SS). This coincides well with the CVR transcript which indicates loud "thumps" at 1527:11.4 (HHMM:SS.0). Based on a simple linear interpolation of the CVR Lat/Long data points, the position of bird strike is approximately N40.8462 - W73.8760. The NTSB Wildlife Factors Report has identified the feathers in the aircraft as Branta Canadensis (Canada Goose) by means of visual, microscopic and DNA analysis. Identification of the feathers was conducted by the Smithsonian Institute Feather Identification Laboratory. Though the errors may be intolerable, it is possible to pursue an altitude calculation for the birds by triangulation, this due to the fact that there are two separate radar facilities that reported data. We know the altitude of the birds at the time of impact, but it may also be helpful to determine their flight profile to understand where they were going or where they departed.. We will attempt this analysis as our work continues on the accident.
The timelapse (10x) animation below presents a detailed view in the area of the bird strike and clearly shows motion, disorganization of the flock following the bird strike, and the subsequent re-organization of the flock(s) following the passage of a second aircraft, Eagle Flight 4718. Aircraft altitude is in 100's of feet. Eagle Flight 4718 actually came quite close to birds but luckily was not on an intersecting flightpath.
We have created the presentation below combining a radar data display, audio from multiple sources (split into left and right channels), a 3D perpective of the flightpath and other ancillary information. Radar data is displayed in the upper right quadrant with aircraft identification and altitude (100's of feet). The audio transcripts are displayed on screen for nearly all communications from the mentioned audio recordings. Continuity is maintained with the transcript, however the audible tracks are faded in and out and selected based on perceived importance to the accident timeline. This combination of information is not a likely candidate for final presentation because of information overload. However, it does illustrate the usefulness and capabilities of a fully integrated reconstruction technique.
The audio presented is:
LaGuardia ATCT Cab Coordinator
LaGuardia ATCT South Terminal Control
New York TRACON South Control
Teterboro ATCT Local Control position
The time lapse (10x) reconstruction below focuses on the radar data, cockpit communications and a simple visualization of the aircraft's flightpath. It is not intended to simulate the radar display that the controller would see, but rather serves as a tool to visualize the data. The flight numbers and altitudes (100's of feet) are shown for most aircraft. Primary radar returns are shown with open boxes, beacon only returns are shown with triangles and beacon reinforced data is depicted with small plus symbols. Data for JFK and EWR radar facility are both displayed. Data with altitude information has been slant range corrected, whereas primary returns are not corrected for altitude (and thus do not project accurately when overlaying data from the two radar facilities). Time is shown in Zulu (UTC) and audio captions are displayed as well (although at 10x speed, they have much less meaning).
Teterboro and La Guardia runways are highlighted to help in orientation. A high resolution satellite image serves as the basemap to this animation. The raw radar returns (primary returns) are displayed as open boxes and clearly show the movement of several flocks of birds in the mapped area. Movement of the flocks is readily apparent, especially at 10x speed; however the radar controllers typically have chosen to filter these primary returns from display. Situations faced by the controllers dictate their workload and many other operational factors would combine to determine whether or not this information should be visible. It would be possible, for example, that a controller's attention could be diverted from the task of maintaining aircraft separation. A great deal of research has gone into avian radar systems in the hopes that an automated recognition and warning system could be created. Future radar installations may have hardware or software (or both) upgraded. This work has long been in the making and accidents such as Flight 1549 may just give developers the momentum they need to find a solution.
NEXRAD Weather data has been time-correlated to our accident reconstruction and does NOT indicate that the flock of birds was observed on weather radar. Further analysis may eventually refine this hypothesis. Other individuals have presented images of the Level II NEXRAD reflectivity data from KOKX (New York City, NY/Upton) at a timeslice of 202811 (elevation angle of the slice of 0.48 degrees) which show a "return" that is very near the aircraft's position at the time. Unfortunately, the NEXRAD data is recorded at approximately 10 minute intervals, which is not enough to establish a detailed local view of birds. We have interleaved data from KDIX (Philadelphia) and no obvious pattern of bird movement is apparent at this time.
Click to download a Flight 1549 Google Earth KML/KMZ file that you can open and browse. [you may need to change the file extension to .kml, or simply open the .zip file that is downloaded and open the file doc.kml inside]
Flight 1549 Fast Facts:
Date and Time: January 15, 2009 at approximately 3:30pm local time (2030 UTC)
Location: Weehawken, NJ
Aircraft: Airbus A320-214, SN 1044
N Number: N106US
Flight Code: AWE1549 (Operated by US Airways, formerly America West)
Injuries: 5 serious of 155 on-board
Transponder Code: 7134
NTSB Group Chairman's Aircraft Performance Study: December 10, 2009, PDF Download
Airbus Report: April 30, 2010, PDF Download
NTSB Simulator Evaluations: April 14-16, 2009, PDF Download
The Simple Physics of Birdstrikes
The Branta Canadensis has an average mass of about 3700 grams. At the time of impact, the closure rate between Flight 1549 and the flock of birds was approximately 120 m/s [meters per second]. The kinetic energy dissipated by collision with a single bird would be approximately 27,000 Joules. This is about the same amount of energy as a 2,000 pound object traveling 17 mph.
ATC Radar Data (ASR-9 Radar facilities at Newark [EWR] and John F Kennedy [JFK])
The public docket includes the continuous data recordings (CDR) from both JFK and EWR radar facilities. These sites provide tracking data to the controller's terminals which is utilized in air traffic control functions. The raw data files contain a wealth of information such as primary returns from debris, birds, weather and other "objects" that reflect enough radar energy to be measured and recorded. The following data entries in the FAA's Digital Aeronautical Chart Supplement give the location and other information about the radar facilities:
STATE/CITY/ARPT....HT...ASR.....VAR...ARTS...LATITUDE.......LONGITUDE....ELEV
New York (JFK).....17...ASR-9...13W...III....40 38 22.4.....073 45 59.2..12
Newark (EWR)............ASR-9...13W..........40 40 23.6.....074 11 08.7..
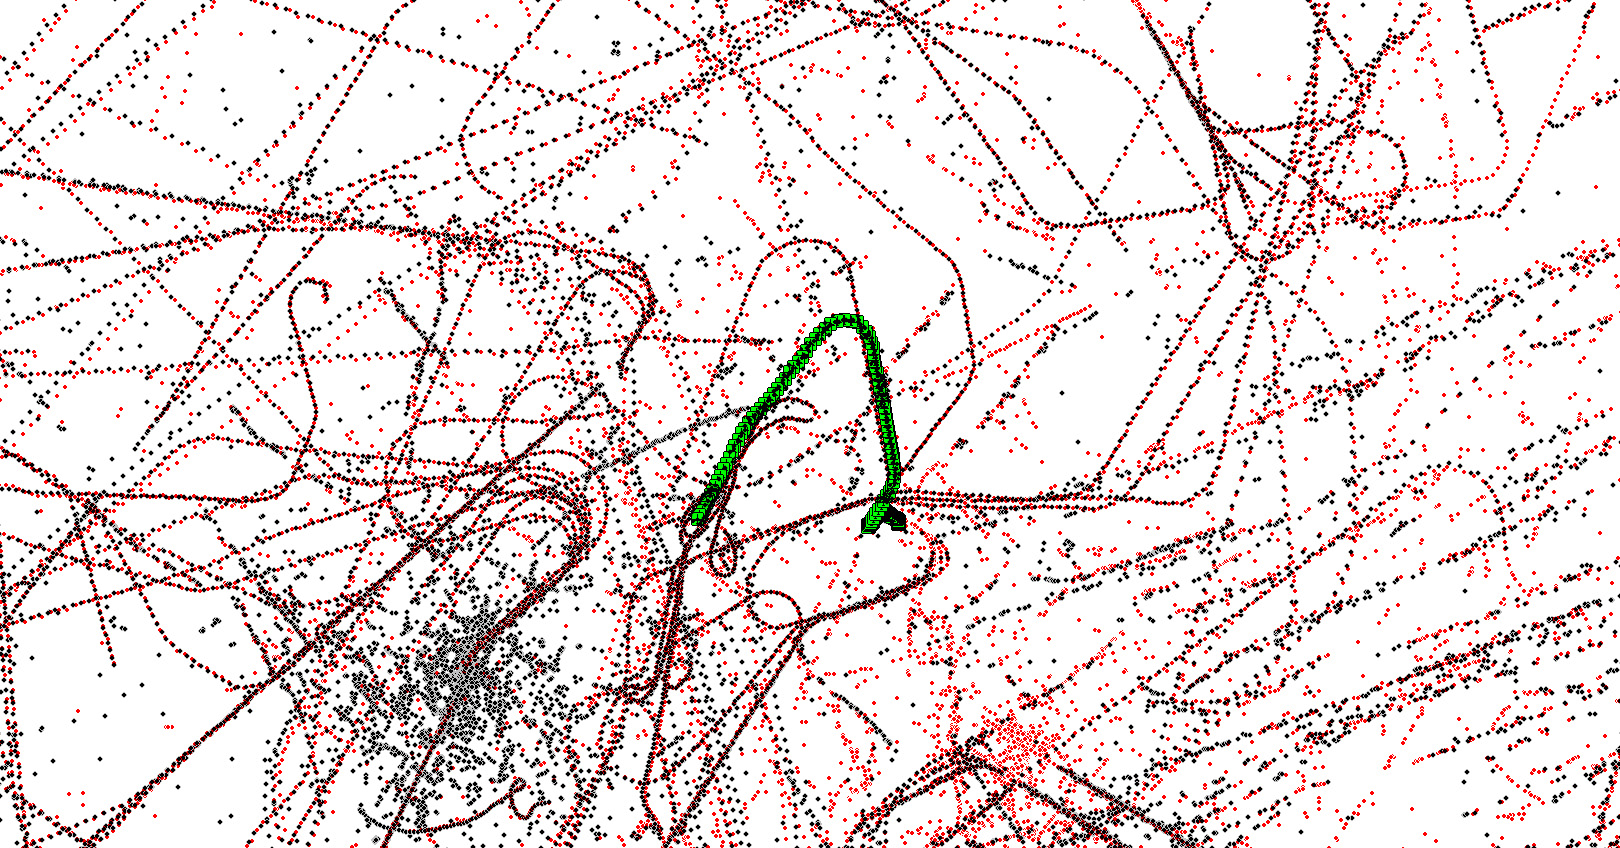
The composite image below shows all target data (BT, RT, RB: Beacon Targets, Radar Targets and Radar Reinforced Beacon) as extracted from the data files provided by the NTSB. The raw data files for each radar facility are more than 1 million lines each and must be sorted and reduced into meaningful information before they can be plotted on a map. We have created our own custom software code to handle the data parsing for this task. Latitude and longitude coordinates recorded by the DFDR are used in creating the baseline flightpath, seen below in green. With further processing, these datasets are combined and interpreted to create a more accurate understanding of the events on the accident flight.
Analysis of Altitude Data
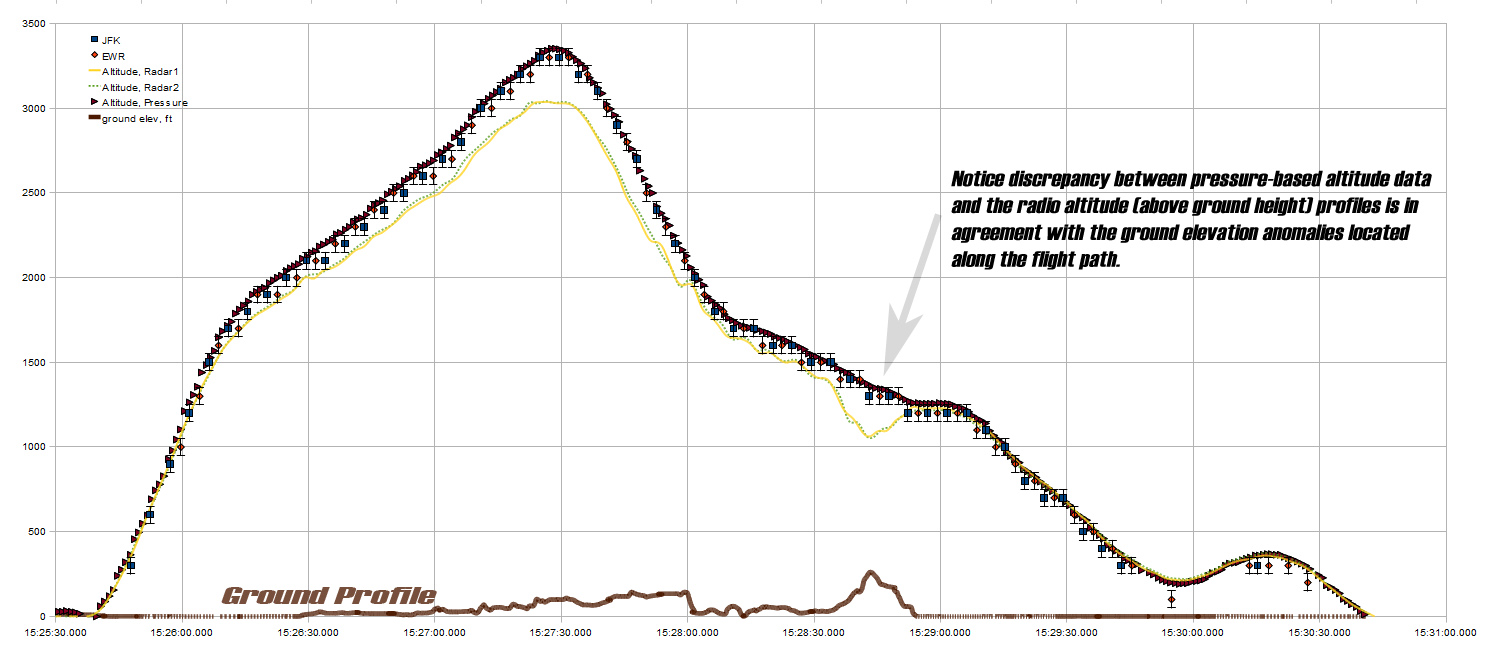
There are six distinct sources of altitude information available for this accident flight. Three of them come from onboard the aircraft via the flight data recorder, they are: Radio Altitude 1, Radio Altitude 2 and Pressure Altitude (Channels 24, 25 and 23 of the DFDR, respectively). In addition, the ASR-9 Radar facility at JFK and the Newark EWR radar site have altitude information recorded which was encoded by the aircraft's static air system. The last source of altitude information is very limited in scope: the video footage that shows the final seconds of flight and splashdown.
Altitude information from static air sources onboard the aircraft can be erroneous when sideslip or abnormal angles of attack are encountered. The readings will be affected by flaps, slats, airspeed and other factors. Extensive analysis would be required to make the best estimate of the actual static pressure at which each altitude data point was generated. Atmospheric profiles of temperature, humidity, and pressure are needed to correct these measurements and create a true altitude measurement. Furthermore, any instrument that measures pressure will experience a lag, because it takes time for the air to enter or escape the measurement apparatus. Another consideration is that the altitude reported by transponders is "categorized" to the nearest 100 feet. Depending on the setup of the individual transponder, the trip point between encoded altitudes is typically from 40 to 60 feet below or above the altitude point recorded. Trip points for the altitude encoder may be different when approaching the same altitude point from above or below. For example, a reported altitude of [2,600] feet may be initiated at 2,560 feet during a climb profile and at 2,640 in a descent profile. There can be hysterisis as well, where a climbing profile going up through 2,560 may cause the encoder to report [2,600] but if the aircraft again begins descending, it may continue to report [2,600] until reaching 2,540 feet, at which time it will report [2,500].
"Radio Altitude" is the measured height of the aircraft above ground measured by timing radar pulses emitted from the radar altimeter antenna. On the flight data recorder, this altitude channel is sampled at high rates and is typically quite accurate. However, the height of the ground below the flight path must be accounted for in reducing the data. A digital elevation model is loaded into the project's workspace and the height of the ground for the flight profile can be calculated. Many factors need to be considered in a robust analysis of radio (radar) altitude. The radar altimeter will actually determine the closest return within a pseudo-conical area. In normal flight conditions (limited pitch and bank,) the instrument will simply "find" the highest ground elevation point within a given radius of a ground location directly beneath the aircraft's flightpath. In cases of high bank and pitch, radar altitude can be erroneous due to the fact that it is not "looking" directly beneath the aircraft. If the aircraft's location, pitch, bank and heading are known reasonably well, a spatial analysis tool can be utilized to identify the point of terrain that will generate the shortest return path within the radar altimeter's cone of measurement. In collaboration with other data sources, this is a verification and refinement tool available for the accident reconstruction.
Careful alignment and scrutiny of the altitude profiles can sometimes be a crucial tool in correcting for timing errors between data sources. Because the aircraft only traveled on one altitude profile, there are certain ways that the available data must fit to this profile. In some situations, just a few data points can lead to important conclusions that could possibly define a timeshift between data sources.
All altitude profiles can be plotted on a single graph and shifted in time, scale and offset which results in an overall "best fit" of the true altitude profile for the accident flight. The images below depict the alignment of these data sets as well as the ground elevation profile of the flightpath.
Audio Recordings and Transcripts
We have processed the FAA released audio files and transcripts and aligned the individual files to a composite timeline. It is critical for the accuracy of a reconstruction to perform a detailed temporal analysis of the data, including thorough cross-referencing each transcript. The processed audio timeline that we create will be more accurate than any single piece of information taken out of context of the overall accident timeline.. The transcribed times from the FAA, while approximately correct, are often far from "precise". When each second counts and situational awareness is important, a detailed and robust approach will be the most reliable. With the release of the cockpit voice recorder transcript (and hopefully the audio recording itself), we have been able to refine our audio analysis. Unfortunately though, the CVR transcript for the Flight 1549 accident has been mostly recorded in whole second timing. This is likely due to the fact that the NTSB did not feel it was necessary to use sub-second accuracy due to the circumstances of the accident.

Below are the transcripts of the various radio positions involved in the accident flight, as prepared by the FAA (or download via FTP_Flight_1549_Audio Transcripts). In addition, the FAA has released the audio recordings for these positions. Those recordings are available from the FAA website (or download via FTP Flight 1549 MP3 audio files).
LaGuardia_ATCT_Cab_Coordinator
LaGuardia_ATCT_Clearance_Delivery
LaGuardia_ATCT_Ground_Control
LaGuardia_ATCT_Local_Control
LaGuardia_ATCT_South_Terminal_Control
New_York_TRACON_Departure_Control_L116
Teterboro_ATCT_Area_Supervisor
Teterboro_ATCT_Local_Control
Additionally, if you are interested in the NTSB's Cockpit Voice Recorder report and full transcript, you can download that here: Flight 1549 Cockpit Audio Transcript.
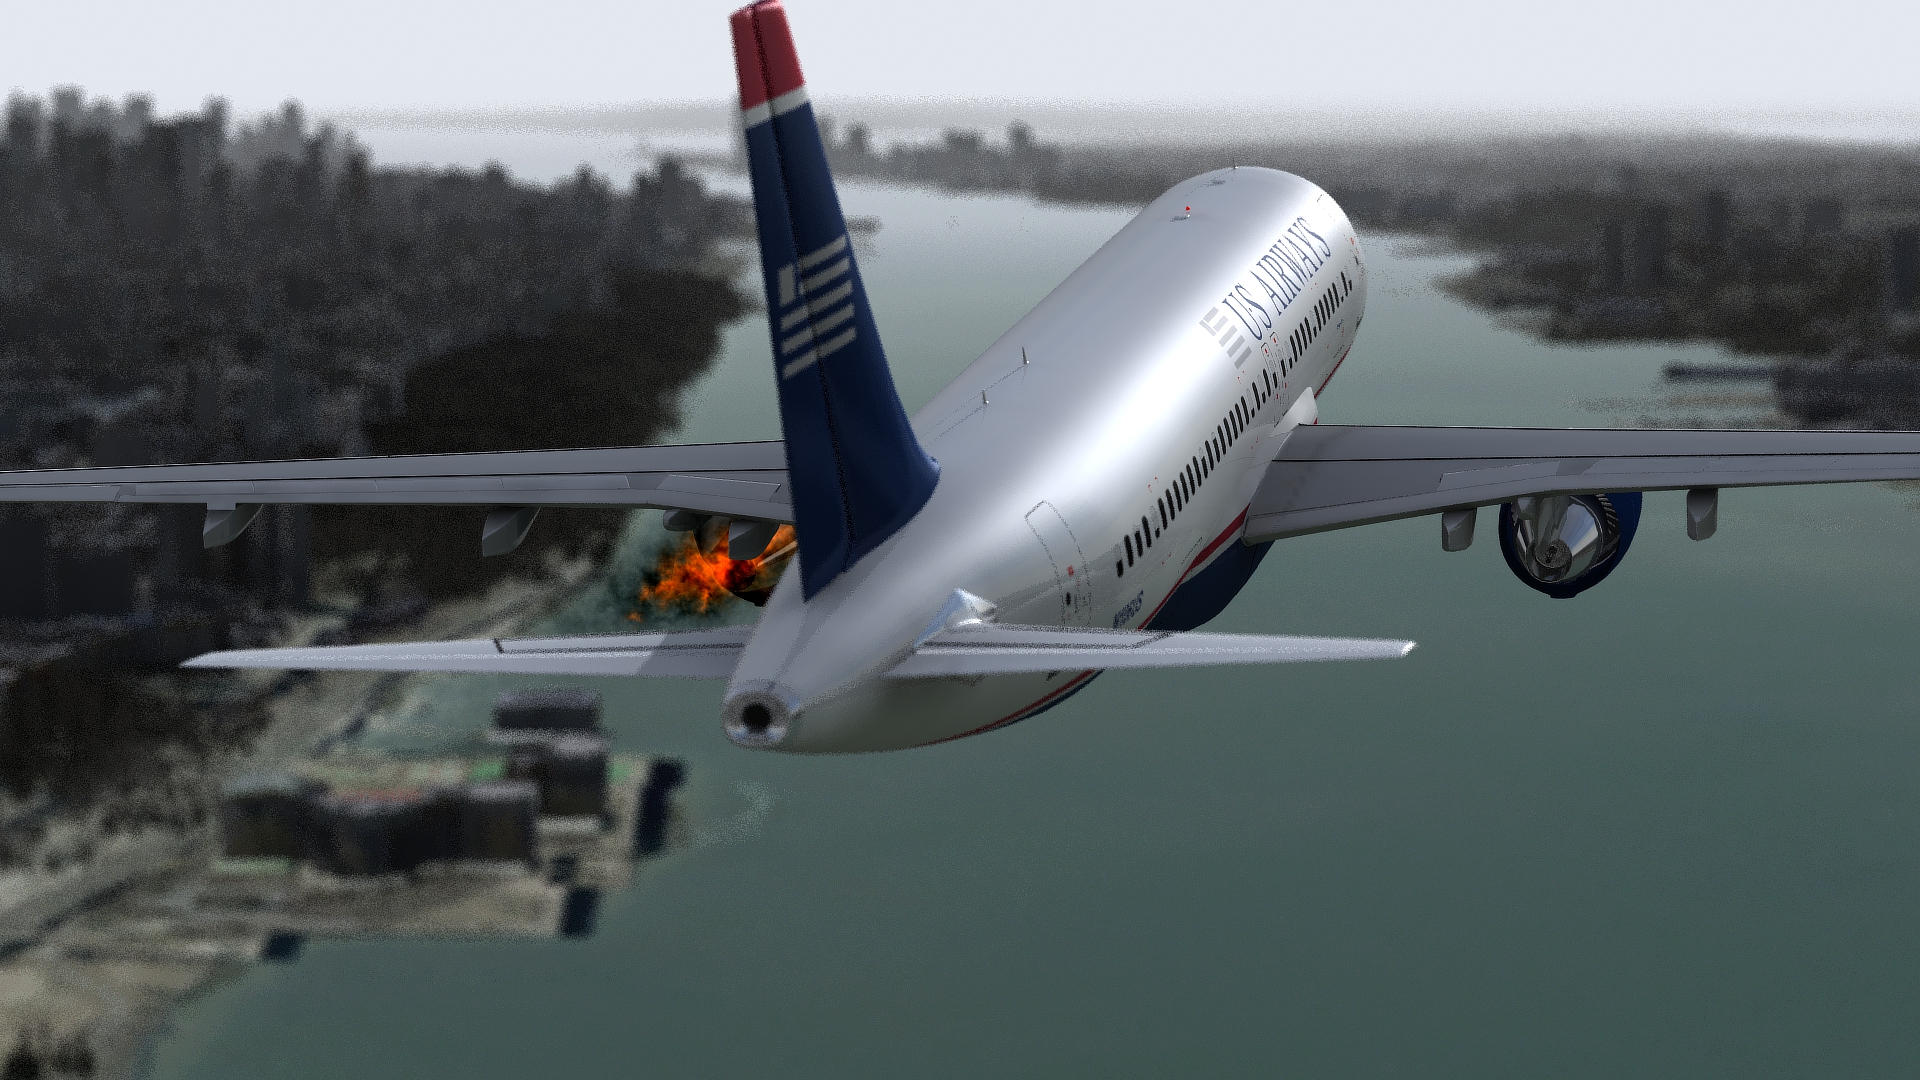
Philosophical Animation Issues
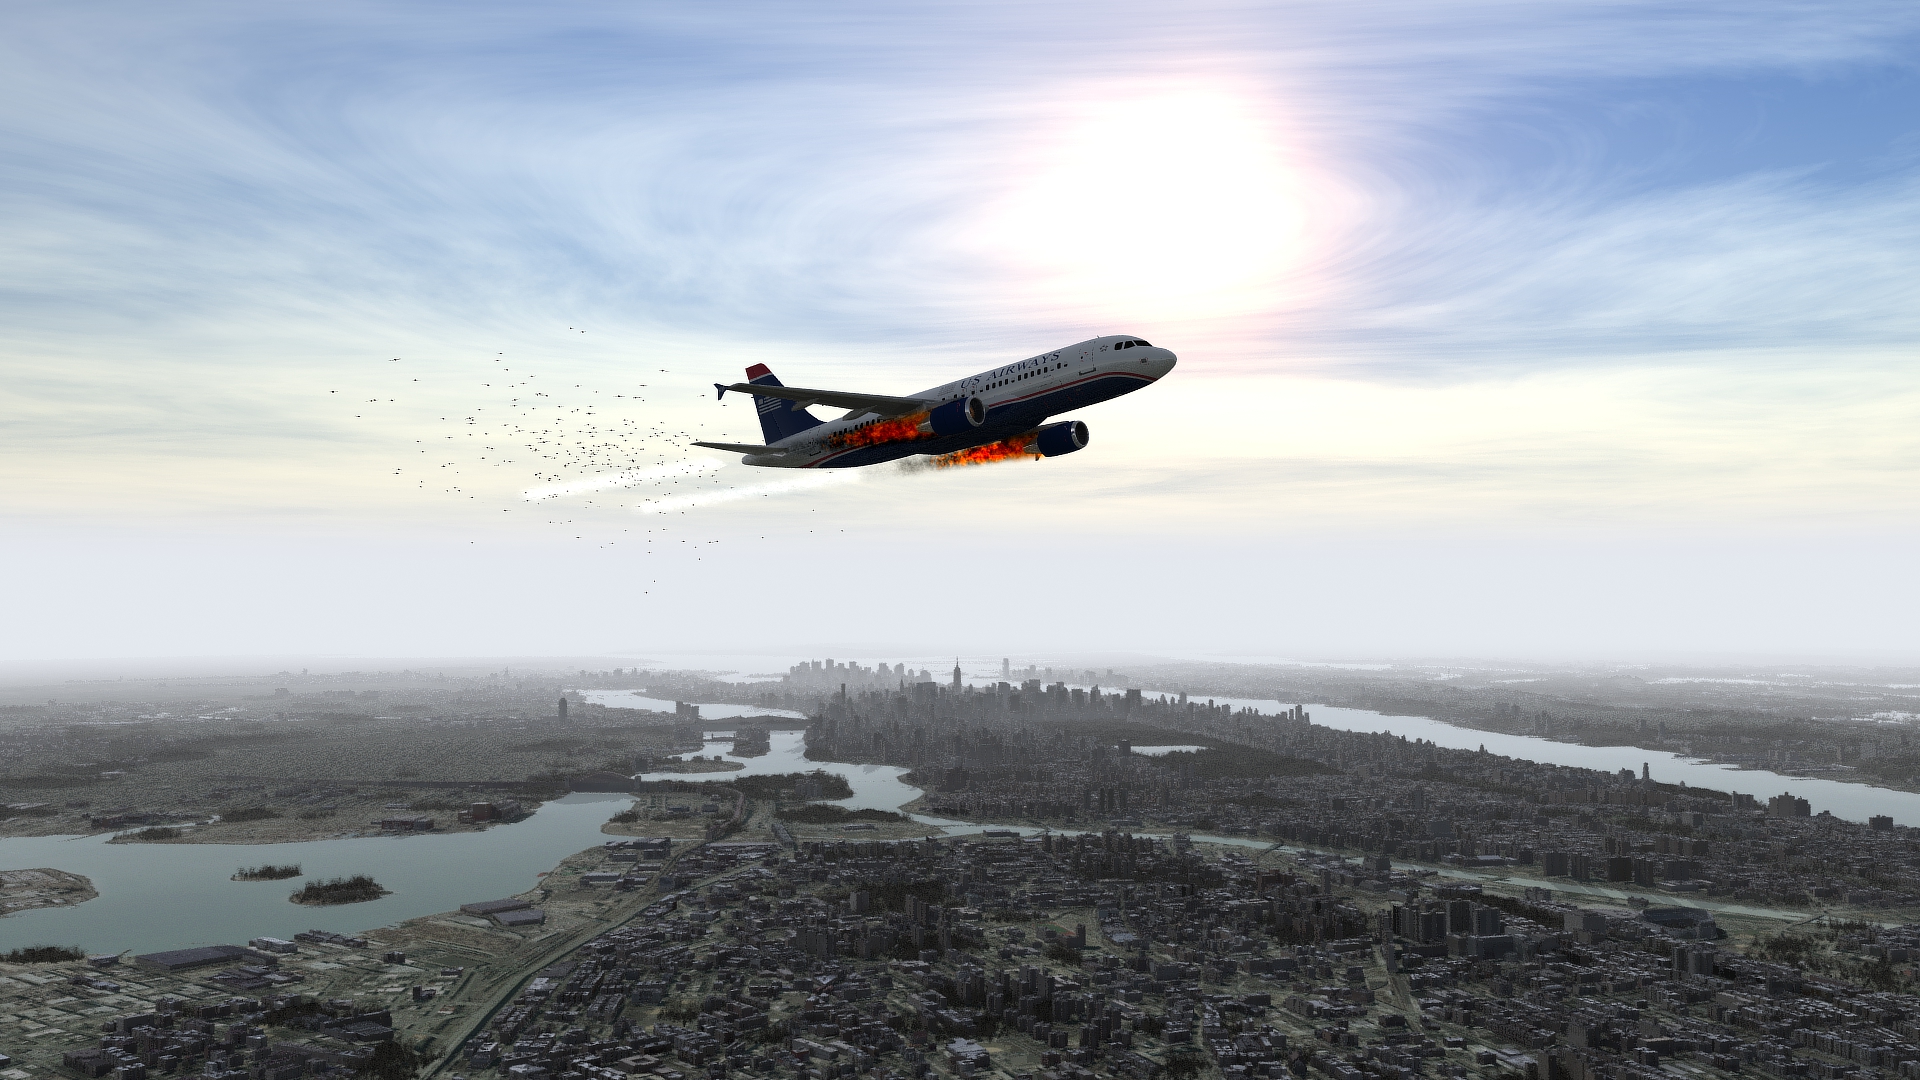
A challenging question arose during preparation of this animation: whether or not to include flames and trails of smoke from the engines. Brief review of the superficial data led us to conclude that there were flames on both engines; some passengers on both the left and right sides reported seeing anything from "flames" to a "fireball and black smoke". The passenger seated in 15F even described feeling heat from the fire on the right side of the aircraft! Many remembered a visible smoke or haze in the cabin and almost all persons onboard recalled a smell of smoke or fire.
Without the means to directly interview the witnesses, we went through the available information and collected facts related to this issue directly. In the NTSB Survival Factor Group Chairman's Factual Report, a summary is provided of each passenger's interview and statement. There were numerous reports of fire coming from each engine, passengers seated in A,B or C seats saw fire on the left side, and vice versa for seats D, E and F. Many passengers did not report seeing the flames but did comment that they heard others say that an "engine was on fire".
During the NTSB's Public Hearings (Day 1, Day 2, Day 3), the passenger in 25A recounted:
I actually kind of got to see your image this morning, so now I think I was about right in terms of 90 to 100 seconds after we had taken off, I did not know the altitude, but there was a large explosion and sitting on the left-hand side, I was able to see out the window and I quickly, like most of the passengers, was startled because the plane shuddered and the engine, the left engine, was on fire. I'd flown many flights and actually -- excuse me -- had a number of friends who are -- pilots so I'd flown a lot and I'd seen engines sparking and a little bit of flame coming out occasionally in other aircraft, but nothing like this.
But my best description of that engine was almost a bonfire, and it continued to flame like that pretty much until we were near impact on the river. But, as we climbed out, I think all of us were not only concerned because of the shudder and the noticeable deceleration. I did find that we continued to ascend a little bit but there was also a very distinctive smell of jet fuel and I think that all of us in the back were a little concerned that there might be a fire, also, inside.
The witness was directly questioned if he remembered flames from the engine during the entire portion of the flight subsequent to the bird strike and he said "definitely" and that perhaps they diminished during the later portion of the flight. An engineer from CFM International, Les McVey, was later called to the stand to testify and was queried specifically about the above quoted testimony. McVey stated that neither engine "flamed out" during the accident and went on to describe the phenomena that would lead to visible flames from the engine following a bird strike:
What happened on this engine was the core was severely damaged and had little airflow flowing through it. So although it could keep the core rotating at something like 80 percent speed, the fan didn't have enough airflow through that core because of the damage to power the fan. So what we ended up with was it was feeding it fuel and the fuel was coming out the back, out of the nozzle, the core nozzle, and once it got to the oxygen on the outside it could burn there. So you're seeing a fire out of the nozzle which was just unburned fuel. It didn't catch fire as would be defined for the large bird requirement.
Despite compelling witness testimony and the engineering explanation provided by McVey, a quantitative basis is needed for the fire and smoke displayed in the reconstruction. The flight data recorder logged engine information including N1, EGT, fuel flow and many other parameters. We decided that the fuel flow parameter would be an appropriate "relative" indicator of the amount of flames in each engine. Our research also turned up a video showing a bird strike event during takeoff and the subsequent engine fire.
These data were used collectively to create what we felt was the best representation of the elements of the accident sequence. All aspects of the animation are subject to this same level of development and must be given every consideration with respect to foundation. Collaboration with experts who have direct experience can sometimes be required. If there is any question as to the validity of a certain element in the reconstruction, a second manifestation that removes that element may be the only answer.
Human Factors
One of the more interesting, but less discussed, subjects regarding Flight 1549 is human factors. Obviously there is much to learn from the cockpit but there is also a lot to learn from the passengers. The NTSB Survival Factors Group Chairman's Report has a summary of the interviews with each passenger. You might also enjoy reading the NTSB study on Life Vest Retrieval published May 2003. These documents are among the many that contain valuable insight into human performance.
To illustrate the depth to which each aspect of the accident has meaning, consider the Captain's choice of words, "This is the Captain, brace for impact". If he had said "brace for water impact", then more passengers would be prepared to don life vests or to take a seat cushion with them. However, had he said those words, perhaps the severity of the landing would be underestimated and more people may have been injured? Sully's testimony at the NTSB hearings gives some great insight into the complex thought processes that even a simple cabin announcement may entail:
I tend to think that I wish I'd had more time to more fully apprise the flight attendants of the situation that we faced. I probably spent some amount of time -- I would guess I had maybe four or five seconds to decide to make the announcement and what I should say and I chose my words carefully. My highest priority, at that moment, was to avoid passenger impact injury. I didn't know at that moment how successful I would be in trading air speed for sink rate to cushion the touchdown, so my immediate concern, my highest priority, had to be to avoid passenger injury at landing, so I chose the word impact and brace to indicate that they needed to brace themselves to avoid impact injury.
I knew that the flight attendants would do their assessment prior to opening the doors and I wish I could've told them there was a water landing, but had I done that, they might've begun getting people to put on life vests and not being in the brace position at impact, so it was a balancing act for the situation that we faced and the time that we had available.
The varied conditions of each accident scenario will require complete and unbiased understanding prior to drawing conclusions. Luckily, in this accident it is apparent that the "balancing act", by everyone, was successful in preventing the loss of life.
The Birds
The object(s) used in this animation to represent the "birds" have been greatly simplified from the actual geometry of a canada goose, and further, is not an accurate "flock" geometry. Like any other visual element of a reconstruction, consideration and compromise are both required with respect to the details available and the desired end result. The birds are modeled to a scale accurate enough to allow an approximate representation of the speed with which the aircraft encounters the birds and the duration which they might be visible to the pilots.
If human factors such as visual acuity and/or see-and-avoid become an issue in this reconstruction, it will be necessary to consult with biologists and bird experts to correctly ascertain the geometry of the birds and the pattern of the flock. Consideration would also be given to the variation in the birds' attitude (heading/pitch/bank) and wing flapping motion. A vision expert could provide a foundation for the model and the end-representation of the birds as a visual component in the reconstruction. Furthermore, radar experts could opine on the strength and number of primary radar returns and make a determination as to the quantity of birds that may have been present. Collaboration among experts would be beneficial to achieving the most accurate overall visual representation of the geese.
Further Thoughts and Discussion (2016 re-release)
Our new re-render of Flight 1549 accident in an immersive 360-degree view at 4K resolution. This project has taught pilots many lessons over time and the release of Warner Bros “Sully” seemed seems like perfect timing to once again share this experience. I meticulously studied the NTSB docket to prepare this reconstruction and hopefully Eastwood, Hanks, Skiles, Sully, and others took some time to review and reflect on this data-driven timeline as they worked towards accurately portraying this story.
The radar view inset is oriented to north-up and, though difficult to read, provides some spatial and situational reference at times. This is best viewed on two monitors at once, start two copies simultaneously and use one for radar reference and the other for exploring. Alternative, use this video on screen number two, it's an excellent visual of the dialog of all facilities. On a desktop computer, click-drag to look around. On a phone, click drag with your finger, or point your phone if it has accelerometers. If you have Samsung Gear VR, Google Cardboard, Oculus, or other 3D gear, you’re in for a treat. You CAN see the birds coming before they hit, listen for when the controller just says “everyday” and then look to the north, ahead of the aircraft, the birds will hit about 12 seconds later.
Before further discussion, I want to acknowledge the excellent reactions and temperament of both Jeff Skiles (the copilot, a.k.a. “First Officer), and Patrick Harten (the Air Traffic Controller working the New York Departure frequency at the time of the accident). Readers would do well reviewing their testimony, and that of others, available in the NTSB docket as well as the transcripts, video testimony, and accident timeline. There is much more to learn than what we all see in the news.
Some important points:
1) Yes, he could have made it back to LaGuardia or to Teterboro, but only if he turned immediately and even then, it wasn’t going to be guaranteed.
2) Yes, the birds were available on raw radar returns. No, FAA/ATC don’t have adequate systems for processing this “noisy” data. Yes, it is completely feasible to further process raw data and recognize the signatures of birds from primary radar returns. When reconstructing the accident and doing a best-fit analysis, I was able to predict and subsequently confirm the time of collision to within a few seconds.
3) Sully and Skiles had met for the first time a few days prior and this was their first flight together. Skiles had never flown this particular model of aircraft except in a simulator. These two facts alone speak volumes about the training and policies that airlines use.
4) Both Sully and ATC incorrectly called the flight number as 1529 or 1539 (1549 being the actual number).
5) At least one of the flight crew and at least one passenger commented that they did not know the aircraft landed on water and assumed they were back at LaGuardia.
6) Skiles did an awesome job of reverting to checklists, supporting the Captain with information callouts, and doing what a crewmember does best – collaborative problem solving.
7) There was NO checklist for dual engine failure at low altitude and the only available checklist was designed for use at high altitudes where the pilots would have plenty of time to troubleshoot. As a result of this accident, US Airline Pilots Association made the recommendation that all procedures be re-written with logical “opt-out” points for example to get right to the point if time is of the essence.
8) Many people scoff at Harten, the ATC voice who suggested Newark was at 2 O’Clock and 7 miles, while the aircraft was at a few hundred feet and obviously not going to make Newark. Mr. Harten, however, noticed the aircraft gaining altitude on radar and thought they may have regained power and was offering up options. The aircraft gained 150 feet of altitude just prior to landing as they deployed flaps and slowed down, trading airspeed for energy. Please review all facets of a complex event before forming opinions.
9) Skiles actually read and acknowledged a checklist item “ATC notify, squawk 7700” – pilot speak for setting the plane to issue an emergency signal. However, neither Skiles nor Sullenberger actually set the transponder to 7700. As a result, the NTSB made an important recommendation to ATC, that they could *assign* a 7700 code to an aircraft. This is an obvious functionality that unfortunately wasn’t possible 2009. The emergency code makes it easier for all involved to see the aircraft on traffic control displays.
10) Sully declared a “Mayday” which is an official way to let ATC know this is a real emergency, but the transmission was blocked for a few seconds and ATC never heard the mayday. Air Traffic Control never heard him say “Mayday” which might have been helpful.
11) ATC called the aircraft “Cactus”, which goes back to the roots of US Airways in Airzona (America West). Unfortunately, this confused the port authority. Precious time was lost.
12) Every airline passenger probably remembers hearing at least one safety briefing and that you should “turn around, your closest exit may be behind you”. In this accident, many people egressed the aircraft from an exit door that was NOT their closest. Additional rafts at the rear of the aircraft were unusable.
13) One passenger responded to a survey question “Did the pre-flight safety presentation help during the evacuation?” as follows: “I was asleep.” Please pay attention and be prepared.
14) Many passengers didn’t bother, or could not successfully, retrieve a life vest prior to evacuation.
One of the most hotly debated issues I’ve seen is whether or not 1549 could have returned to LaGuardia or diverted successfully to Teterboro. Airbus and the NTSB collaborated on an effort to have pilots attempt this in the engineering simulator at Airbus facilities in France. Of all 15 trials, six pilots attempted returned to LGA runway 22 and two of those made it. Seven attempted return to LGA runway 13 and five made it. Two attempted diversion to TEB and one made it. All in all, about half of the pilots made it to a runway but the other half didn’t do so well. NO PILOTS made a successful runway landing with ANY delay in turning directly to the intended runway (i.e. If they took ANY time to make a decision where to go, they wasted valuable energy to reach the intended destination and landed short).
Capt. Sullenberger gave consideration to turning to Teterboro. This is observed in the reconstruction around 2029Z, you can see him dip the right wing to have a better look at TEB. FO Skiles has remarked that he was concerned when the Captain took a look, but of course we all know they didn’t proceed to TEB and instead chose to ditch the aircraft in the Hudson River. It was immediately after Sully and Skiles assessed, and declined, the option of a TEB landing that the passengers heard “This is the Captain, brace for impact” and Sully subsequently told ATC “We’re gonna be in the Hudson”.
For further FACTUAL discussion on this topic, the reader should follow-up on a FOIA which I issued to NTSB requesting the detailed data from the engineering simulations. The idea was to explore the importance of decision timelines and optionality in emergency situations as well as the fundamental airspeed/altitude/energy questions that are so challenging to convey in flight instruction. Unfortunately, I had to abandon this FOIA and never was able to study my hypotheses. My belief and understanding, based on reviewing the available NTSB/Airbus report, is that the 20 to 30 second delay in assessing the situation was an important deciding factor and that Sully and Skiles probably made a good piloting decision to sink a $40M aircraft in the Hudson….not an easy choice. I have presented this accident along with hour-long open discussion forums to a number of groups. In doing so, several Boeing pilots have suggested that the engines could have made some power even though the fans were severely damaged, and that perhaps the computers prematurely shut them down. I’m doubtful of this, but it’s one of hundreds of talking points that make an event like this such a wonderful learning opportunity for all of us.
Retrieval of the Wreckage
This video, created by David Martin, is a great look at the aircraft as it was moored to shore and subsequently lifted from the river with a huge crane. He captured these images from his apartment.
Other Images:
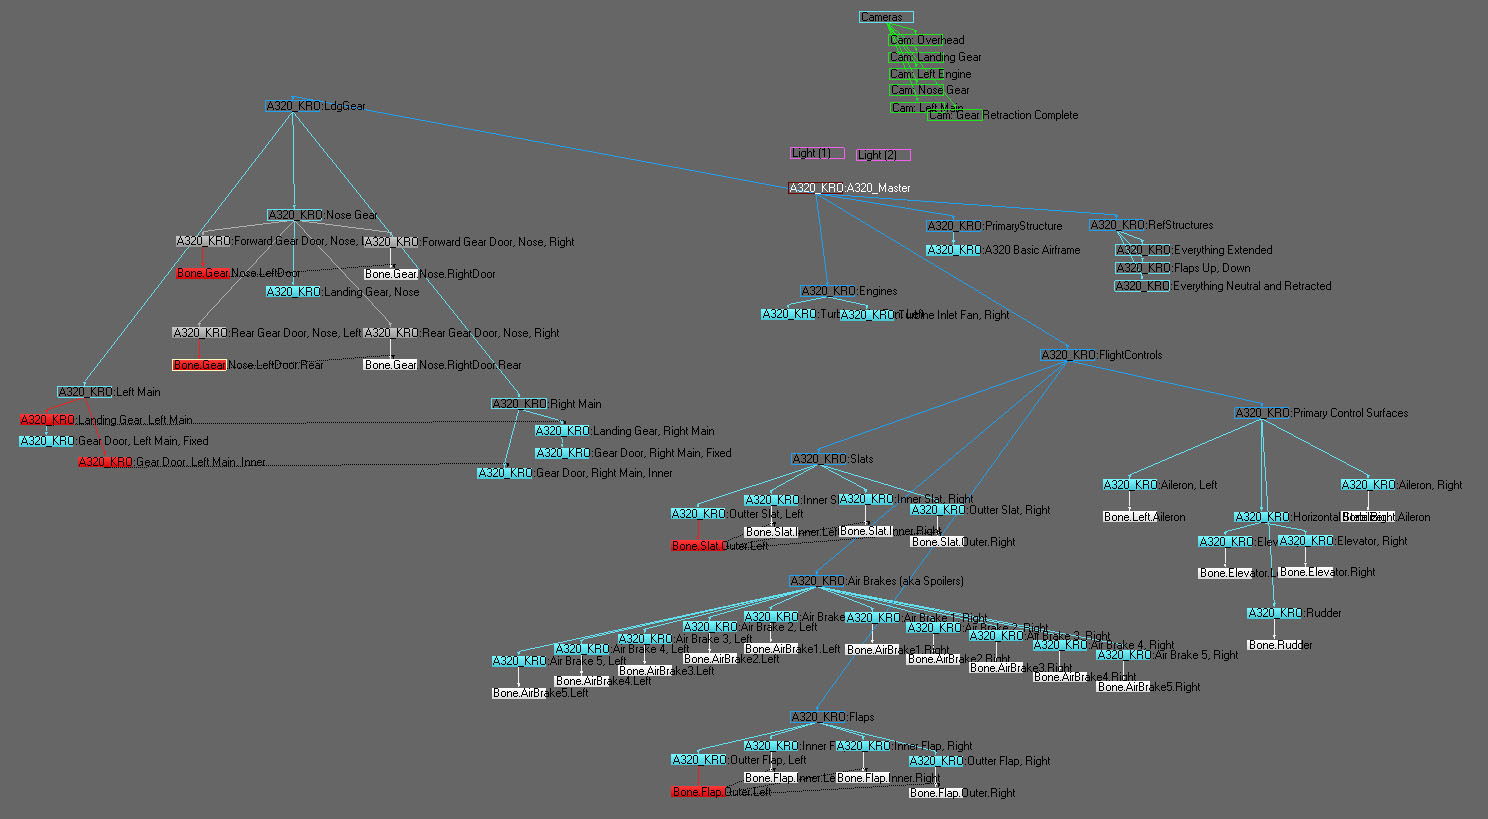
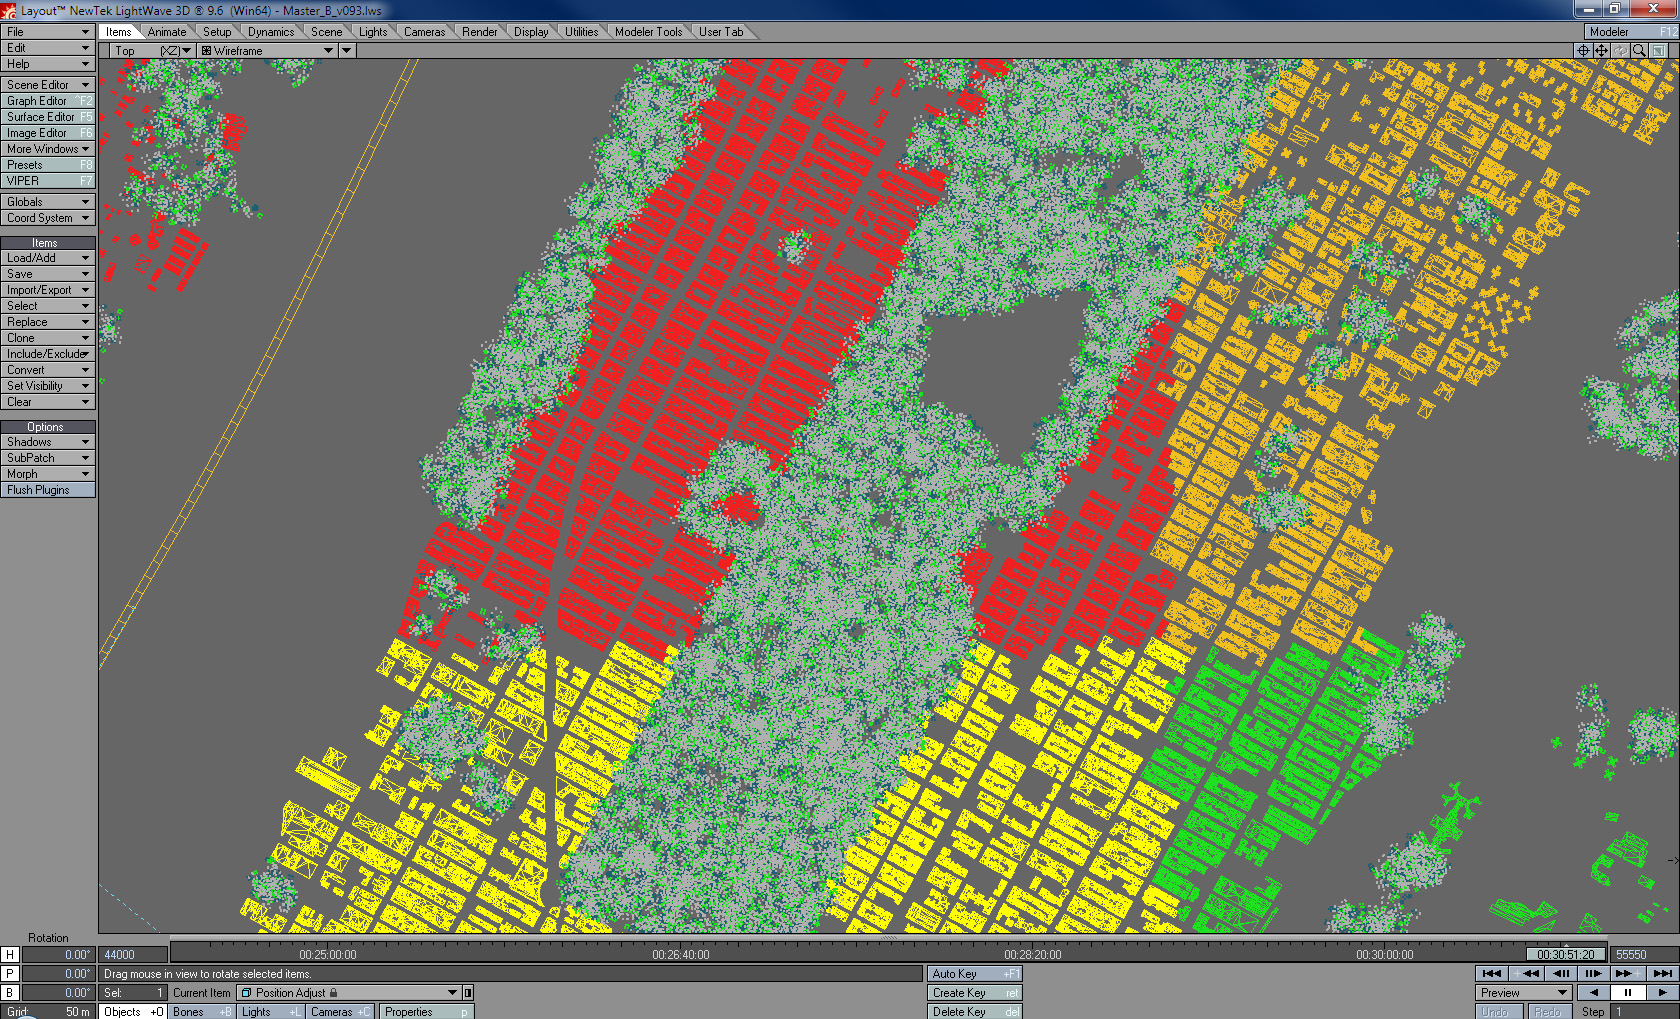
The aircraft rig schematic view in Lightwave:
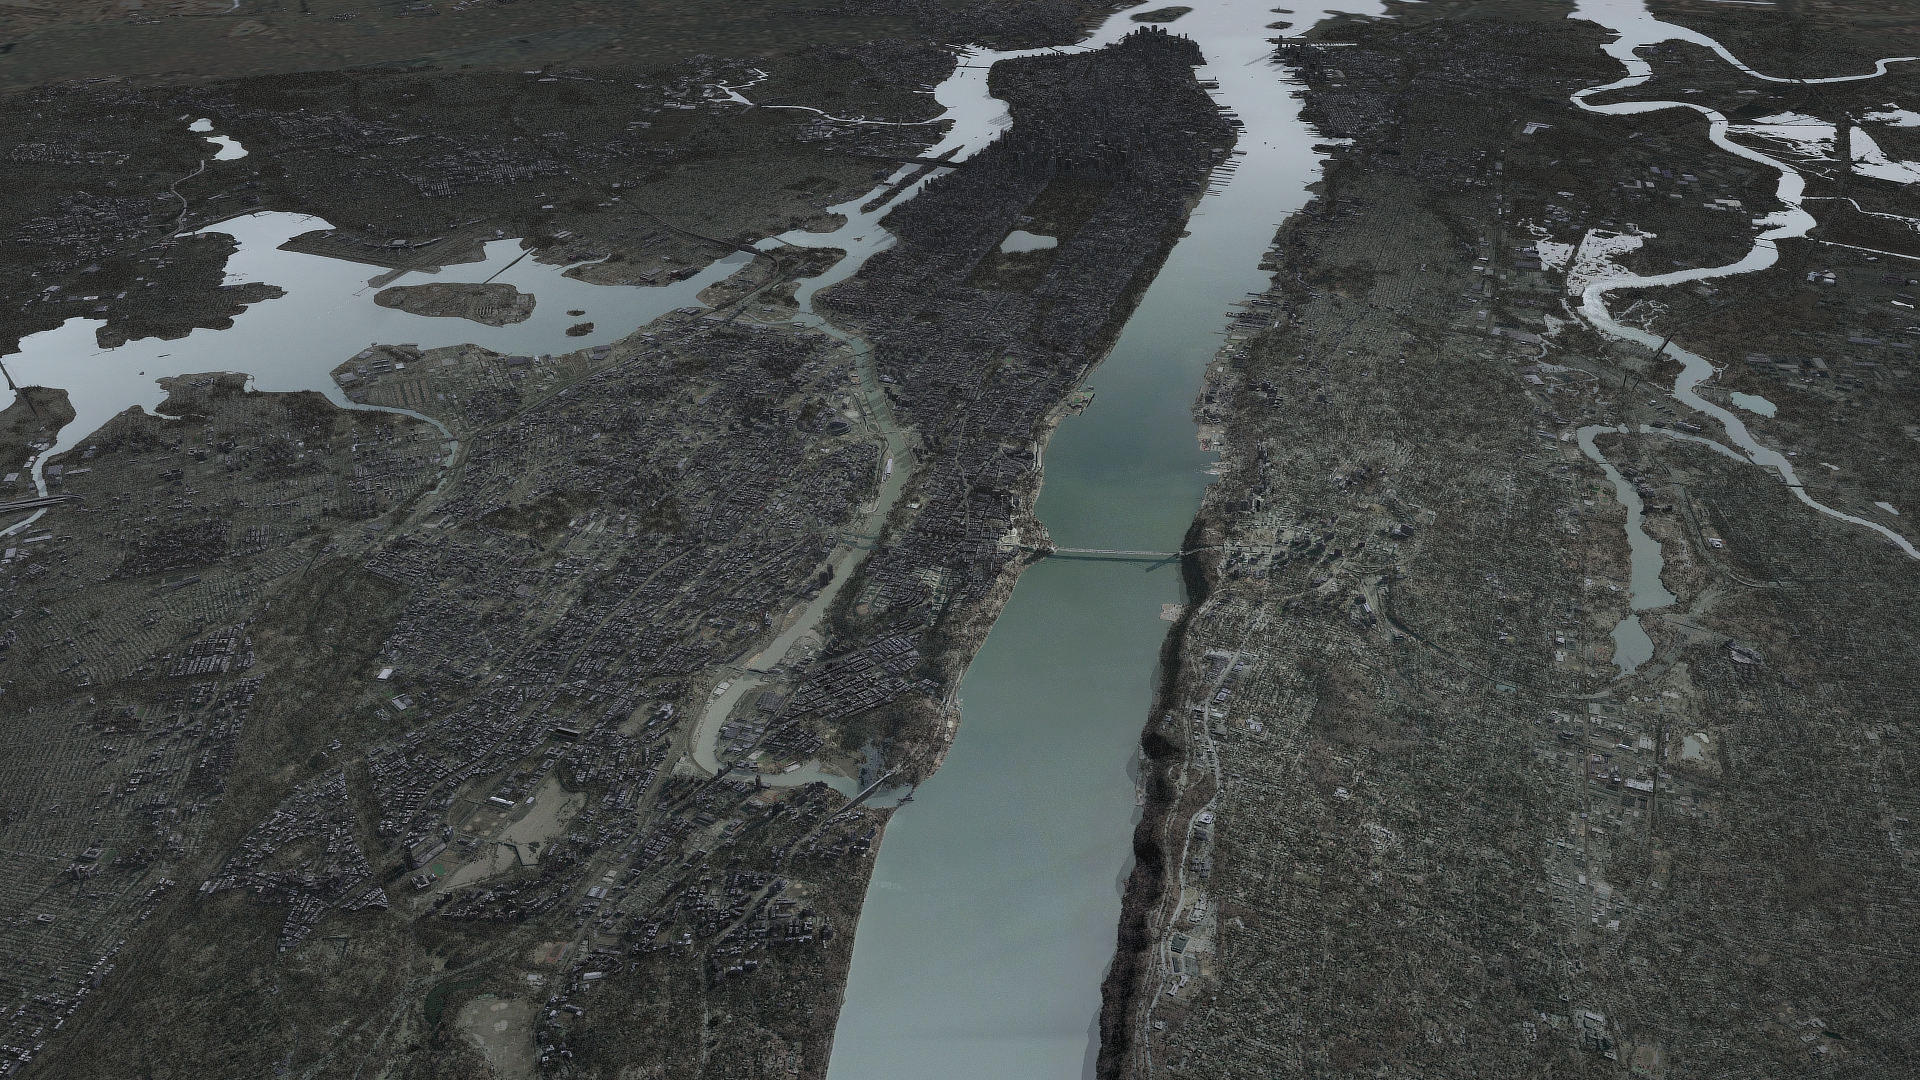
Area centered around central park showing vegetation and building density. A portion of the flightpath is shown at left (orange segmented path).
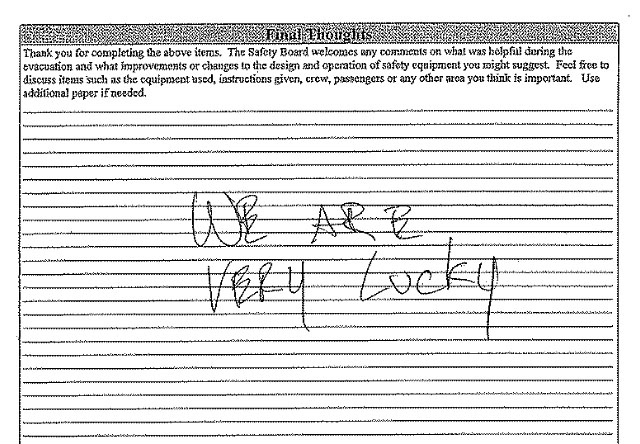
As a final note, the crash landing of USAir 1549 in the Hudson river is best summed up by this passenger's statement, "we are very lucky":
Copyright 2010,2011,2012,2013,2014,2015,2016 Exosphere3D.com